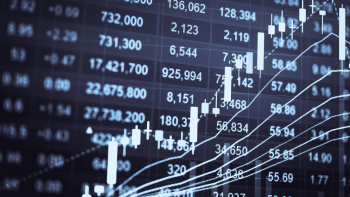
German electricity prices on the EPEX Spot exchange in 2022
- German base electricity price doubles to €235/MWh in 2022 compared to 2021
- Electricity price level on the day-ahead market strongly influenced by the current gas price
- Energy price crisis causes not only very high electricity price level but also strong increase in price volatility
- A bidirectional electric vehicle could have earned €3,000 in 2022 by trading on the electricity market
German base electricity price rises to €235/MWh in 2022
The German base electricity price in 2022 more than doubled again compared to 2021, after prices had already tripled in 2021 compared to 2020. This resulted in an average 2022 base load price of 235 €/MWh. The prices of the peak load (average price on working days Monday to Friday from 8 a.m. to 8 p.m.) and the off-peak load (average price of all hours that are not in the peak) increased analogously. The peak load price was thus 267 €/MWh, and the off-peak load price was €218/MWh. Figure 1 presents the development of base, peak and off-peak electricity prices for the years 2017 to 2022. The ratio of peak to base is 1.1 to 1.2 and has not changed significantly in recent years.

The strong increase in electricity prices, which already started in the 4th quarter of 2021, has been significantly intensified in 2022 by political influencing factors. For this reason, Figure 2 presents the fuel prices and CO2 prices for 2022 in comparison to the daily base electricity price on the day-ahead market. Just as in Q4 2021, the electricity price increase in 2022 is explained by the increase in the gas price, as gas-fired power plants are often price-setting in the electricity market. In 2021, the gas price increase was due to high global gas demand due to Corona catch-up effects, reduced Russian supply volumes, and low gas storage levels (see 2021 electricity price analysis).
The issues of reduced supply volumes and low gas storage levels came to a head in 2022 after Russia started its invasion in Ukraine. As a result, the gas price peaked for the first time at 220 €/MWh on 05/03. Compared to the average price in the years 2019-2021 of just over 24 €/MWh, this is almost a tenfold increase in price. In the following months, deliveries of Russian gas were throttled in many cases, particularly from June 2022, and ultimately completely stopped at the beginning of September 2022. This resulted in a gas price peak of 316 €/MWh on the German day-ahead market, which also led to the highest electricity prices of the year. The low gas storage levels created additional uncertainty in the first half of 2022. In the second half of the year, however, gas storage levels recovered due to efficiency measures and mild weather. In mid-November 2022, a filling level of 100% was reached, so that the target values of the German government were even exceeded.

The coupling of short-term traded electricity and gas prices can be assumed from Figure 2, but not directly proven, since the marginal costs of gas-fired power plants are composed of fuel costs and CO2 costs, which in turn are based on the respective efficiency of the gas-fired power plants. For this purpose, Figure 3 shows for a typical efficiency range of 40-60% of gas-fired power plants their daily marginal costs in 2022 compared to the electricity price. The figure also shows the marginal costs of hard-coal-fired power plants. The dependence of the electricity price on the gas price becomes even more apparent in this figure. The electricity price is not always in the range of the marginal costs of gas-fired power plants, since other technologies also set prices at times. In particular, the influence of wind and PV energy, which offer electricity with very low or even negative prices on the market, increases here. For example, at the end of December, with strong wind energy feed-in and low load, the average daily electricity price on the day-ahead market was significantly below the marginal costs of gas-fired power plants.

For a detailed analysis of the characteristics of the electricity price, Figure 4 maps the hourly (day-ahead market) or quarter-hourly (continuous intraday trading) electricity prices in 2022. The regular daily and weekly profile of electricity prices observed in recent years (2019 , 2020 and 2021) is still evident in 2022, but the politically influenced fluctuating electricity price level is much more prominent. Even in the months of July and August with the highest electricity prices, however, low and in some cases negative electricity prices could be observed at midday, which also highlights the positive, price-dampening influence of PV energy here. Compared to the high number of negative prices in previous years, there were only 69 hours with negative prices on the day-ahead market in 2022. In these hours, the average negative price of -2 €/MWh was significantly lower in amount than in previous years, when it was around -15 €/MWh. This speaks for fewer electricity generation plants accepting deeply negative prices, as discussed in a previous article.

Impact of electricity price level on price spreads and thus revenue potentials of flexibilities
Since the electricity price fluctuations are significantly larger due to the higher electricity price level compared to the last years, the question arises how the spreads and thus the revenue opportunities of flexibilities have developed in 2022. For this purpose, Table 1 shows the maximum hourly and daily price spreads as well as the intra-hourly and intra-day standard deviation of electricity prices on the day-ahead and intraday markets for 2022 compared to previous years. The mean standard deviations are calculated by computing the annual mean of the standard deviations of the electricity price per day or hour. Both the maximum price spread and the mean standard deviations of electricity prices as a measure of price volatility increased in 2022 by more than double the values in 2021. As a result, trading in the electricity market was very attractive for flexibilities in 2022, resulting e.g. in an increasing number of large-scale battery storage projects and the ambition of integrating bidirectional charging of electric vehicles.
In a previous publication [6], we already discussed the revenue potential of bidirectional electric vehicles in the electricity market. In simulations based on this, revenue potentials of 1,000 €/MWh were highlighted for a bidirectional electric vehicle (60 kWh battery capacity, 11 kW charging/discharging power) in 2021. An exemption of the vehicle from charges and levies on temporarily stored electricity was parameterized for this. The revenue potentials refer to the difference compared to the reference case of direct charging with combined marketing on the day-ahead and intraday market. These revenue potentials could be tripled to 3,000 €/MWh in 2022, which should strongly stimulate the use case “trading on the electricity market” for bidirectional vehicles.
| year | day-ahead market (hourly) | Intraday auction (quarter hourly) | quarter hourly continuous intraday trading (mean price) | |||
| daily | daily | hourly | daily | hourly | ||
| Maximum price spread in €/MWh (mean value over the year) | 2022 | 187.0 | 292.7 | 81.6 | 322.4 | 71.3 |
| 2021 | 80.3 | 138.2 | 37.4 | 143.5 | 33.8 | |
| 2020 | 32.5 | 70.0 | 20.2 | 79.1 | 18.0 | |
| 2019 | 30.1 | 53.3 | 16.3 | 62.7 | 14.3 | |
| 2018 | 32.2 | 58.8 | 17.5 | 68.2 | 16.1 | |
| Standard deviation of prices in €/MWh (mean value over the year) | 2022 | 57.3 | 67.2 | 35.9 | 69.2 | 31.5 |
| 2021 | 24.5 | 29.7 | 16.4 | 30.1 | 14.8 | |
| 2020 | 9.4 | 13.8 | 8.9 | 14.9 | 8.0 | |
| 2019 | 9.0 | 11.7 | 7.2 | 13.0 | 6.4 | |
| 2018 | 9.8 | 12.9 | 7.7 | 14.1 | 7.2 | |
An analysis of European day-ahead prices can be found here.
Literatur
[1] EPEX SPOT. 2022. “Market data”, https://www.epexspot.com/en/market-data
[2] EEX European Energy Exchange. 2022. „Spot market data – THE“, https://www.eex.com/en/market-data/natural-gas/spot
[3] ICE. 2022. „API2 Rotterdam Coal Futures Feb23“, https://www.theice.com/products/243/API2-Rotterdam-Coal-Futures/data?marketId=5467846
[4] OPEC Organisation erdölexportierender Länder. 2022. „OPEC Basket Price“, https://www.opec.org/opec_web/en/data_graphs/40.htm
[5] EEX European Energy Exchange. 2022. “EU CO2 Emission Allowances 2023”, https://www.eex.com/en/market-data/environmentals/futures
[6] Kern, Timo; Dossow, Patrick; von Roon, Serafin. 2020. “Integrating Bidirectionally Chargeable Electric Vehicles into the Electricity Markets” Energies 13, no. 21: 5812, https://www.mdpi.com/1996-1073/13/21/5812/htm