Daily updated specific Greenhouse Gas Emissions of the German Electricity Mix
Rising demand for individual carbon footprints
Individual initiative in the fight against climate change is possible in many areas. It ranges from reduced meat consumption to the renunciation or reduced use of cars with combustion engines to sustainable financial investments. Both environmentally conscious consumers and companies are increasingly becoming aware of the carbon footprint and want to contribute to a solution. Sustainability also plays a central role in the energy supply sector.
Data on greenhouse gas emissions
Dynamic Greenhouse Gas (GHG) emission factors combined with electrical load profiles enable the calculation of individual GHG footprints. The particular amount of electric energy purchased from the grid multiplied by the emission factor for the respective region (e.g., a country) is a reasonable indicator for the emissions caused by power consumption. In this way, the individual GHG footprint of consumers can be determined ex post and, if necessary, settled via service providers like atmosfair.
The GHG emissions can already be reduced in the electricity consumption using the day-ahead forecast. The data can for example be integrated into smart home applications (e.g. Home Assistant) to control high-consumption appliances such as washing machines and dryers so that they are used when the GHG emissions in the electricity mix are lowest.
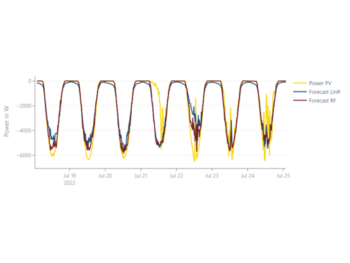
To enable and promote sustainable behavior, two datasets are provided on the FfE Open Data Platform. One dataset is calculated ex post using actual energy production by energy source, while the other one is a forecast (ex ante) which is generated using machine learning methods. Figure 1 displays both data sets for three days. Both data sets are updated daily between 8 and 10 pm (CET/CEST).
Methodology
The code implementing this method is open-source and publicly available on GitLab.
The main data basis for the calculation is electricity generation by energy carrier in Germany. Electricity consumption, imports and exports, as well as grid losses are not taken into account. The emission factors (ex post) are calculated by multiplying the amount of electricity generated by energy carrier 1 by the specific emissions of that energy carrier. The specific emissions already take into account the upstream chain, which is why renewable energies, for example, also have a certain CO2 footprint.
The historical specific GHG emissions were calculated using the above ex post method for the same period. Thus, for each hour of the training period, the target value (specific GHG emissions) is known in addition to the input data, so that the model can “learn” their relationship (supervised machine learning). All input data are available as day-ahead forecasts on the ENTSO-E Transparency Platform, so that the trained model can be used to forecast the GHG emissions of the German electricity mix for the coming day. To account for the uncertainty of the forecast, two additional values are returned in addition to the actual forecast value. To account for the uncertainty of the prediction, two additional values are included besides the actual predicted value. The upper and lower bounds serve as an indicator of how accurate the prediction of the model is.
Figure 1: Specific greenhouse gas emissions of the electricity mix in Germany for three days as forecast (ex ante) and measured values (ex post). Der vollständige data set as well as an up-to-date version of this figure is available at the FfE Open Data Platform.


Deviations in emission factors taken from other data sets (such as CO2-Signal) can be essentially explained due to the choice of different emission factors for energy carriers as these have a major influence on the results. To check the plausibility of the data (calculated using ex post method), the annual mean values are compared with data from the Federal Environment Agency (UBA) (see Figure 3). The comparison shows a maximum deviation of 2.5 % for the values of the year 2020.

The dataset has among others been used during the field test of the InDEED project (funding code: 03EI6026A).

Further notes
The software used as an interface to the ENTSO-E Transparency Platform is based on freely available code from the project electritiymap.
The datasets can be accessed on the FfE Open Data Platform via these links:
Since the datasets are the result of an automatically performed calculation which depends on data provided by the ENTSO-E Transparency Platform, it cannot be guaranteed that the automated calculation will always work. Thus, sometimes failed calculations may have to be performed again manually.