FREM Article Series: Weather Data
Weather data play a central role in power system analysis by enabling the calculation of volatile renewables’ weather- and season-dependent generation output. Photovoltaic systems only produce electricity when there is sufficient solar radiation, while wind turbines can only operate between certain wind speeds. What sounds trivial is highly complex in the actual calculation: the solar energy hitting the solar modules depends, among other things, on cloud cover, albedo, atmospheric reflection, and the angle of incidence, which in turn depends on the sun’s path. In order to be able to calculate the electricity generation from wind power, on the other hand, the various wind speeds must be determined as a function of the (hub) height, and the air density must be taken into account. The weather data providers usually only supply individual parameters, from which these values must be calculated in advance. Here we give an overview of the weather data used at FfE.
Overview of the topics in the FREM Article Series
Comparison of Weather Models
MERRA-2
The “Modern-Era Retrospective analysis for Research and Applications, Version 2 (MERRA-2)” of NASA’s Global Modeling and Assimilation Office represents the first global weather dataset implemented at the FfE. The MERRA-2 project began in 1970 and since then has continuously collected comprehensive data on various parameters of the Earth’s atmosphere, oceans, landmasses, and aerosols. MERRA-2 provides parameters as averages over 1, 3, 6, or 24 hours. At the FfE, hourly mean parameter values from 1980 to the present are used.
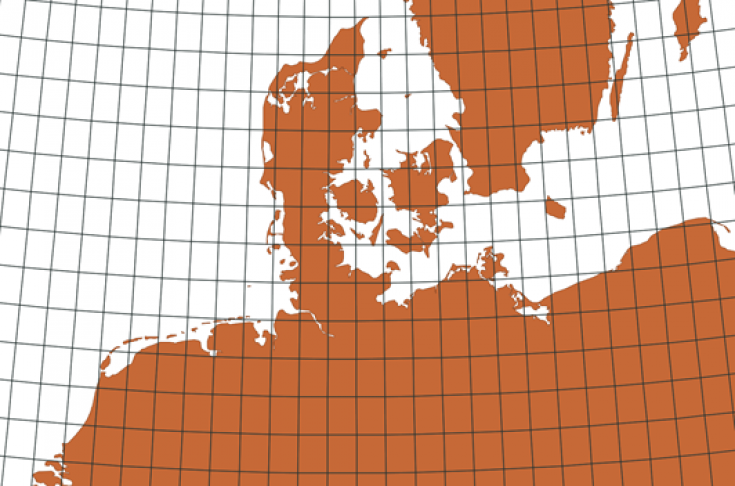
The MERRA-2 datasets are displayed on a grid of 0.625° longitude and 0.5° latitude of the WGS84 coordinate reference system, which is available in FREM as a vector geometry with EPSG code 4326. Since an ellipsoid of revolution mathematically describes the Earth, the metric grid size of the grid cells varies as a function of latitude. Thus, at a latitude of 10° N, the grid corresponds to a size of about 74 km wide and 51 km long.
Modeling of the wind speeds
Using the wind vectors U10M and V10M for westerly and southerly winds at 10 meter height, as well as U50M and V50M at 50 meters, the resulting wind speeds are first calculated for each grid cell at 10 and 50 m height:

Wind speeds at other heights are calculated using the logarithmic wind profile, taking the atmospheric stability factor into account. To keep the amount of data small, only the velocities at heights of 60, 80, 100, 120, and 140 m are calculated. This allows generation profiles to be determined for the most common hub heights.
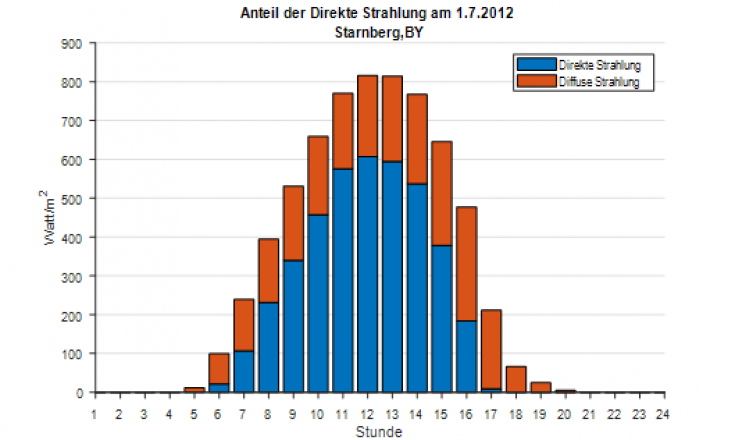
Solar radiation modeling
The direct and diffuse components of total solar radiation are both needed to model PV generation profiles. However, the MERRA-2 dataset only provides total solar radiation on horizontal surfaces on the ground, extraterrestrial solar radiation, and albedo. Therefore, the radiation fractions are calculated using the Erbs model. As an example, the fractions of direct and diffuse radiation over a day for the Starnberg, Bavaria are shown in Figure 3.
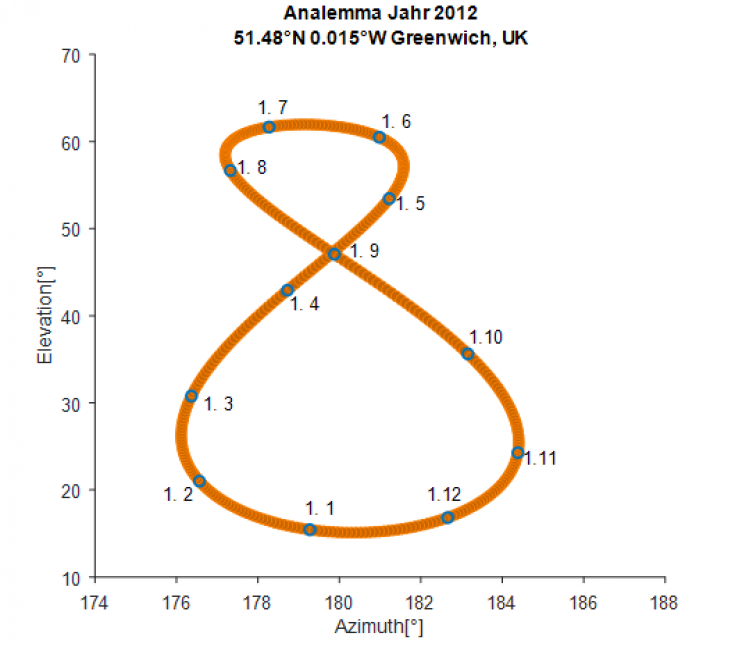
Calculation of the sun position
In order to calculate the incident solar radiation on a PV module, the exact position of the sun is first required. This is calculated for all hours of the year and all centroids of the MERRA-2 cells and is shown in Figure 3 as an example for the location Greenwich, UK, for all days of 2012 at 12 o’clock.
Subsequently, the angles of incidence of the solar radiation on the inclined surface (the PV modules) must be determined, and the incident reflected radiation must be added to obtain the total incident radiation.
In the last step, the low-light behavior of the modules as well as the influence of the temperature on their performance are taken into account, and are applied to the total radiation as reduction factors depending on radiation and temperature, respectively.
ICON-EU
The ICON-EU model of the German Weather Service (DWD) is the weather model used at the FfE for the longest time and has replaced its predecessor COSMO-EU after the latter was discontinued by the DWD. While the COSMO model still covered Europe with a horizontal resolution of about 7 km up to an altitude of 24 km, the ICON-EU has a horizontal mesh size of about 6.5 km and extends up to an altitude of 75 km. The model variables that the FfE obtains from the model are air density, albedo, temperature, and wind speeds. The parameters relevant for calculating the generation paths are determined analogously to the calculation of the MERRA-2 parameters.
The ICON-EU model is primarily used for European observations, since it offers a significantly better resolution than MERRA-2.
CAMS
The Copernicus Atmosphere Monitoring Service (CAMS) is one of six services that make up Copernicus, the European Union’s Earth observation program. Copernicus provides information services based on satellite Earth observation, in-situ (non-satellite) data, and modeling.
The CAMS radiation service provides a time series of global, direct, and diffuse radiation on the horizontal surface and direct radiation on the normal plane for current weather conditions and clear sky conditions 1 .
Both 1-minute and 15-minute radiation times are used to calculate photovoltaic generation profiles for Europe, depending on the application. Except for Sweden and Norway, the radiation time series provided by CAMS spatially cover the area of Europe and have a measurement point spacing of 0.2°.
ERA-5
The latest addition to the FfE weather data portfolio are the two datasets ERA-5 and ERA-5-land, from ECMWF (European Centre for Medium-Range Weather Forecasts). ERA-5 provides global hourly atmospheric as well as land- and ocean-based weather parameters at a resolution of 30 x 30 km, while ERA-5-land is a derived dataset covering the European landmass at a resolution of 9 x 9 km. The ERA data currently extends back to 1979, perspectively even to 1949, and help the FfE, among other things, to form long-term averages.
Generation Profiles
Based on the previously calculated weather parameters, time series of generation for photovoltaics and different wind turbines are generated, with the spatial resolution depending on the weather model used.
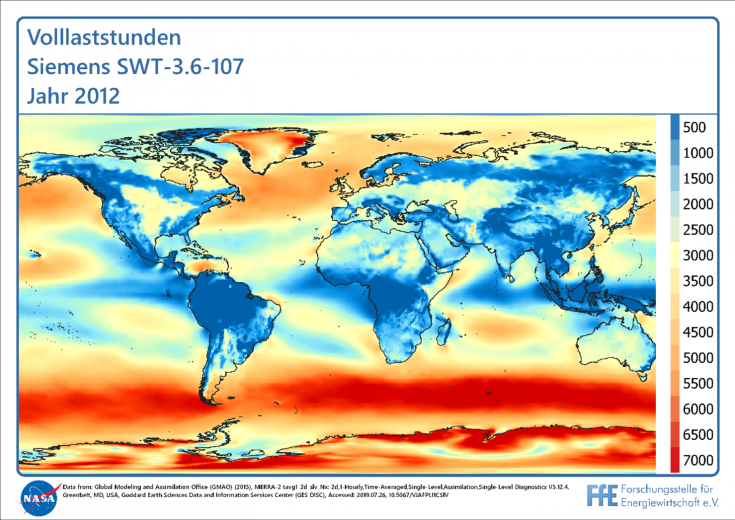
The hourly generation curves for wind power are calculated based on calculated rotor efficiency, rotor area, air density, and wind speed. The quotient between the power P and the rated power of the wind turbines gives the achieved full load hours. Figure 6 shows a world map with full load hours of an exemplary Siemens wind turbine, based on MERRA-2 data.
In the case of photovoltaics, the generation paths are derived from the previously determined parameters. Figure 7 shows a world map with the full load hours for PV at optimal tilt and orientation of a unit per cell. Also shown in the left margin are the optimal orientation parameters for the corresponding latitude circle. The basis here is also MERRA-2.

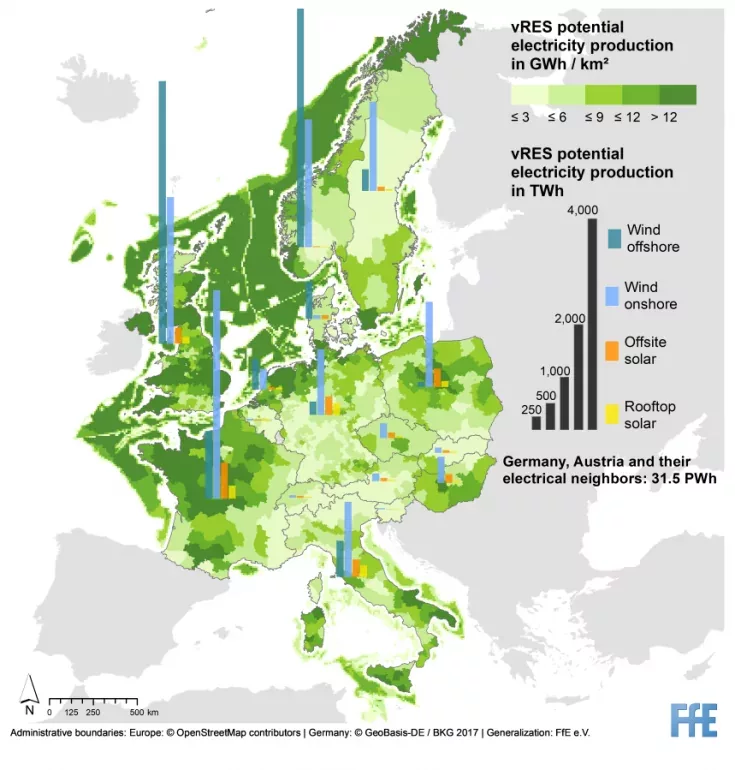
Application Examples
The determined generation paths represent a central basis for further energy system analysis at the FfE. For example, they are used for the regional determination of renewable energy potentials, as shown in Figure 8. In addition, weather data are also used for the weather-based adjustment of consumption data or the determination of heating and cooling degree days.