Siemens Global Energy Demand – Modeling global power consumption
Within the scope of the project “Global Energy Demand” for the client Siemens, a worldwide and regionally resolved map of the electricity demand was to be achieved based on statistical and geo-data. Analysis was conducted separately for private households on the one hand and the sectors trade, commerce, services and industry (TCSI) on the other hand.
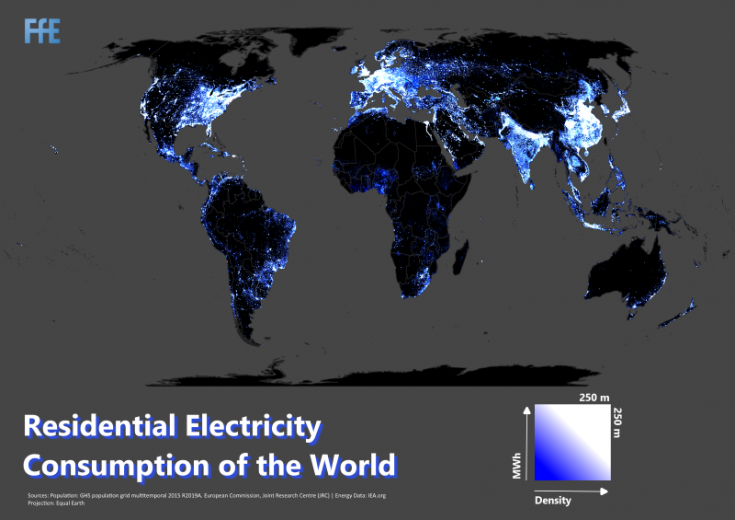
A grid-based approach was used, which generates worldwide indicators on 250 m x 250 m pixels, which are then scaled to a consumption grid with corresponding consumption figures. This approach offers the advantage that consumption figures can be flexibly adjusted, e.g. to map different years.
For the regionalization of private households, population figures based on the Global Human Settlement Layer [1] were used as indicators. For the TCSI sectors, the areas marked as commercial, industrial and retail from the OpenStreetMap project [2] were used. Prepared data from the latter were also used to assign the corresponding raster data sets to the individual countries. In addition, the model allows local or regional adaptation by transferring own administrative geometries, for which improved knowledge about the exact consumption is available. The model then independently corrects the distribution of electricity consumption in these regions and also adjusts the values outside of them so as not to distort the total consumption of a country.
Furthermore, one area of the project dealt with the question of whether night-time light emission, especially in less developed countries, can contribute to improving the distribution of consumption in private households. Therefore, the so-called nighttime-lights data set of NOAA [3] was used and integrated as a further indicator for the regionalization of the electricity consumption of private households. It was shown that these data, due to their high sensitivity, are able to detect even small settlements not covered by the Global Human Settlement Layer.
One result of the project is shown in Figure 1: a global representation of the electricity consumption of private households for the year 2015 on 250 x 250 m pixels, in MWh.
Sources:
[1] GHS population grid, derived from GPW4, multitemporal (1975, 1990, 2000, 2015): http://data.jrc.ec.europa.eu/dataset/jrc-ghsl-ghs_pop_gpw4_globe_r2015a; Brüssel, Columbia: Joint Research Centre (JRC) European Commission, Center for International Earth Science Information Network – CIESIN Columbia University, 2015.
[2] OpenStreetMap (OSM) – OpenStreetMap und Mitwirkende: http://www.openstreetmap.org/; Cambridge: OpenStreetMap Foundation, 2004 (überarbeitet: 2019).
[3] Version 1 VIIRS Day/Night Band Nighttime Lights – Nighttime Light Composite: https://www.ngdc.noaa.gov/eog/viirs/download_dnb_composites.html; Asheville, Vereinigte Staaten: Earth Observation Group, NOAA National Centers for Environmental Information (NCEI), 2012 (überarbeitet: 2015).